Apps Usage Report
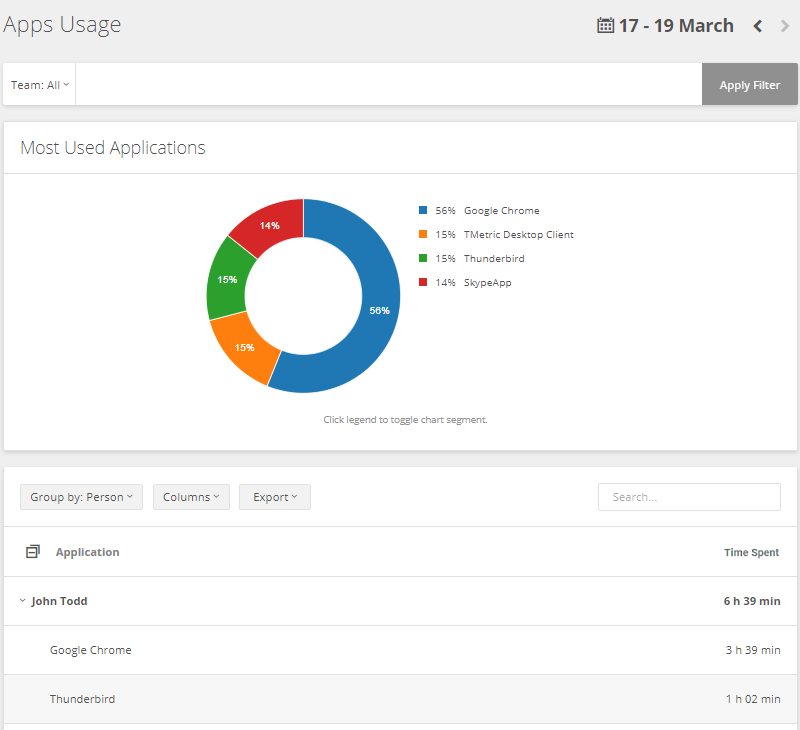
The Apps Usage report provides statistics on the most used applications both in the form of a visual graph showing apps usage represented in percents and a table with data showing app names and users' time spent on each app. The applications are tracked by TMetric Desktop.
Time Range
You can select a required time range in the date picker located at the top right corner of a report: Today, Yesterday, Current Week, Last Week, Current Month, Last Month, All Time, and Custom Range. The report will display the apps used during a specified period of time.
Filter
You can filter report data by applying the following filters: Teams and Users. Just click the Team drop-down button and check a person name or a team in the list you want to get a report on and click Apply Filter.
Note: Project Manager can only see his name in the Team drop-down list.
Groups
Data in a table can be organized either by Person or Application grouping categories. You can select a category you need in the Group by drop-down menu.
Chart
The report includes a colored chart that helps show proportions and percentages between the most used applications contained in the report table. You can click each legend to toggle a chart segment.
Column customization and export
You can customize a report by including/hiding the following columns: Person, Application, and Time Spent. Click the Columns drop-down button, check/uncheck the columns you need and click Apply.
Once you build a report, you can export it as a PDF or a CSV file.
See Also
Didn’t find what you were looking for?
If you didn't find what you were looking for, you can make a support request or email us to [email protected]. We'll be glad to help you personally.